 Facebook
 X
X
 Pinterest
 Copy Link

The following analysis of the Western Washington real estate market is provided by Windermere Real Estate Chief Economist Matthew Gardner. We hope that this information may assist you with making better-informed real estate decisions. For further information about the housing market in your area, please don’t hesitate to contact your Windermere Real Estate agent.
REGIONAL ECONOMIC OVERVIEW
The emergence of the of COVID-19 Delta variant had a palpable impact on the region’s economy, which, naturally, impacted the job recovery. Employment levels in Western Washington had been picking up steam in the spring but started to slow quite dramatically over the summer. To date, the region has recovered more than 201,000 of the jobs that were lost due to the pandemic, but we appear to be in a bit of a holding pattern. That said, the ending of enhanced unemployment benefits has led many business owners to see more applicants for open positions, so I am hopeful the numbers will pick back up as we move into the winter months. The most recent data (August) shows the region’s unemployment rate at a respectable 5%, but we still have a way to go before we reach the pre-pandemic low of 3.7%. On a county level, the lowest unemployment rate was in Kitsap County (4.4%) and the highest was in Grays Harbor County (6.6%). There are still many hurdles in front of us, but I believe we will continue to add jobs and reach full employment recovery by mid-2022.
WESTERN WASHINGTON HOME SALES
❱ Sales in the third quarter rose 6.4% year over year, with a total of 27,280 homes sold. The increase matched what we saw in the second quarter of this year.
❱ I was pleased to see sales growth continue. This rise was supported by a 28.4% increase in the number of homes for sale. Listings rose the most in Grays Harbor (+62.6%), Lewis (+53.6%), and Skagit (+52.0%) counties.
❱ Sales activity was mixed. Nine counties saw year-over-year growth, but sales slowed in six counties. That said, sales were up in every county other than King and San Juan compared to the second quarter of 2021.
❱ The ratio of pending sales (demand) to active listings (supply) showed pending sales outpacing listings by a factor of 4.6. Even with the increase in the number of new listings, the market is far from balanced.

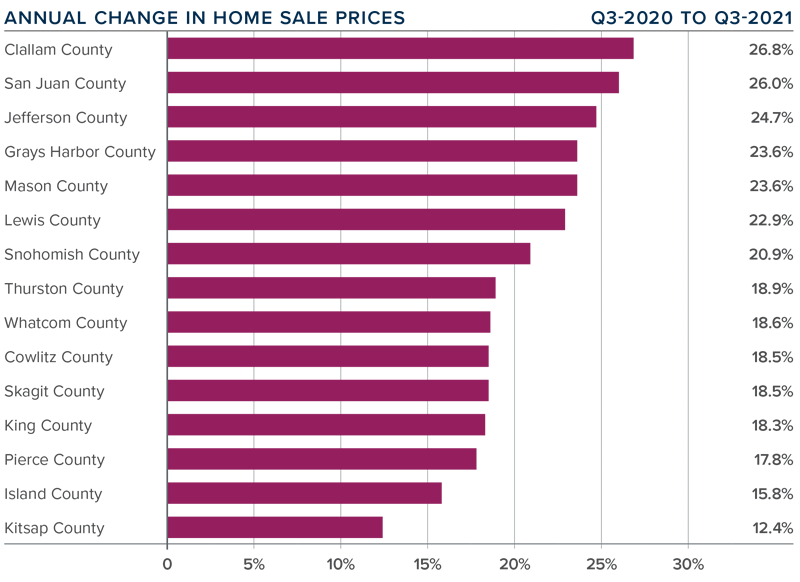
WESTERN WASHINGTON HOME PRICES
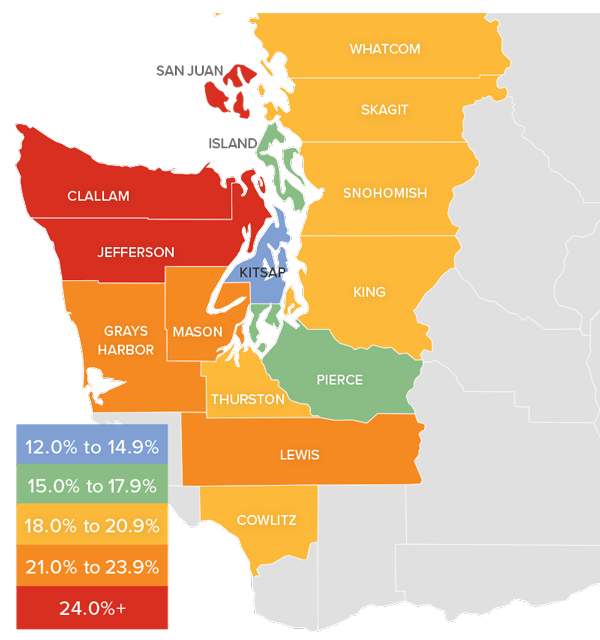
❱ Home prices rose 18.9% compared to a year ago, with an average sale price of $726,168—another all-time record.
❱ When compared to the same period a year ago, price growth was strongest in Clallam, San Juan, and Jefferson counties, but all markets saw prices rise more than 12% from a year ago.
❱ Average sale prices pulled back 1.1% compared to the second quarter of this year. Given the massive increase in value over the past few years, it is not at all surprising. The key indicator has been a softening in list prices and that naturally translates to slower price growth. This is nothing to be worried about. It simply suggests that the market may finally be heading back to some sort of balance.
❱ Relative to the second quarter of this year, all counties except San Juan (-0.1%), Island (-0.5%), and Whatcom (-0.5%) saw higher sale prices.
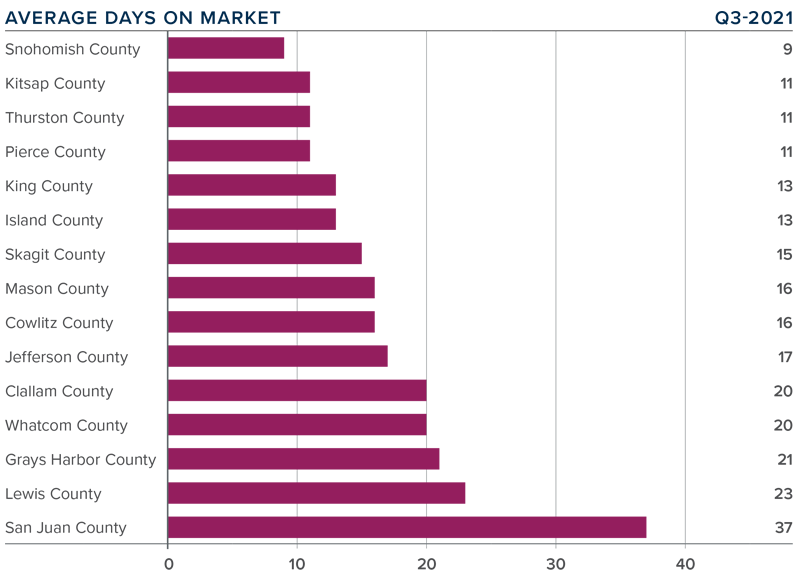
DAYS ON MARKET
❱ It took an average of 17 days for a home to sell in the third quarter. This was 19 fewer days than in the same quarter of 2020, and 1 fewer day than in the second quarter of this year.
❱ Mirroring the second quarter, Snohomish, Kitsap, Thurston, and Pierce counties were the tightest markets in Western Washington, with homes taking an average of 9 days to sell in Snohomish County and 11 days in the other three counties. The greatest reduction in market time compared to a year ago was in San Juan County where it took 102 fewer days for homes to sell.
❱ All counties contained in this report saw the average time on market drop from the same period a year ago, but eight counties saw market time rise from the second quarter; however, the increases were minimal.
❱ Even with inventory levels increasing in most markets, the region’s housing market remains remarkably tight. That said, I do see some of the heat dissipating and I am hopeful that if inventory levels continue rising, we will start a slow move back toward a balanced market.
CONCLUSIONS
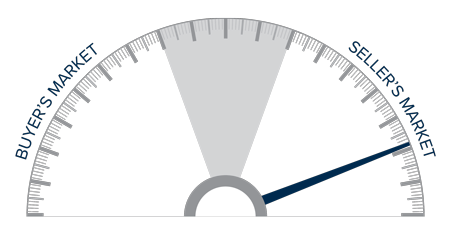
This speedometer reflects the state of the region’s real estate market using housing inventory, price gains, home sales, interest rates, and larger economic factors.
Even given the speedbump that hit the region’s economy with the emergence of the Delta variant, the housing market remains remarkably resilient. Demand from buyers continues to be very strong, and modestly increasing inventory levels appear to have—at least for the time being—reduced some of the fever from the market. Mortgage rates remain very favorable, and my current forecast is for them to stay in the low- to mid-3% range until next summer. Rising inventory levels have led price growth to slow and days on market to start increasing, which may be a sign that the market is retreating from a prolonged period of exuberance.
As we move through the balance of the year, I believe demand will remain solid, but we will continue to see price growth soften as more listings compete for the buyers that are out there. That is not to say price growth will turn negative; rather it suggests that we are slowly moving back toward a more balanced market. That said, the market certainly still favors home sellers. As such, I am leaving the needle in the same position as the second quarter. I may move it a little in the direction of buyers next quarter if the current trend continues through the winter months.
ABOUT MATTHEW GARDNER
As Chief Economist for Windermere Real Estate, Matthew Gardner is responsible for analyzing and interpreting economic data and its impact on the real estate market on both a local and national level. Matthew has over 30 years of professional experience both in the U.S. and U.K.
In addition to his day-to-day responsibilities, Matthew sits on the Washington State Governors Council of Economic Advisors; chairs the Board of Trustees at the Washington Center for Real Estate Research at the University of Washington; and is an Advisory Board Member at the Runstad Center for Real Estate Studies at the University of Washington where he also lectures in real estate economics.

