 Facebook
 X
X
 Pinterest
 Copy Link

The following analysis of select counties of the Western Washington real estate market is provided by Windermere Real Estate Chief Economist Matthew Gardner. We hope that this information may assist you with making better-informed real estate decisions. For further information about the housing market in your area, please don’t hesitate to contact your Windermere Real Estate agent.
Regional Economic Overview
The Western Washington labor market continues to expand. The addition of 110,000 jobs over the past 12 months represents an impressive increase of 4.9%. In total, the region has recovered all the jobs lost and has added an additional 30,000 new positions. The regional unemployment rate in August was 3.8%. This is .2% higher than at the end of the second quarter. That said, county data is not seasonally adjusted, which is likely the reason for the modest increase. The labor force has not expanded at its normal pace, which is starting to impact job growth. Although the likelihood of a recession starting at some point this winter has risen, I am not overly concerned at this point; however, I anticipate businesses may start to taper hiring if they feel demand for their goods and services is softening.
Western Washington Home Sales
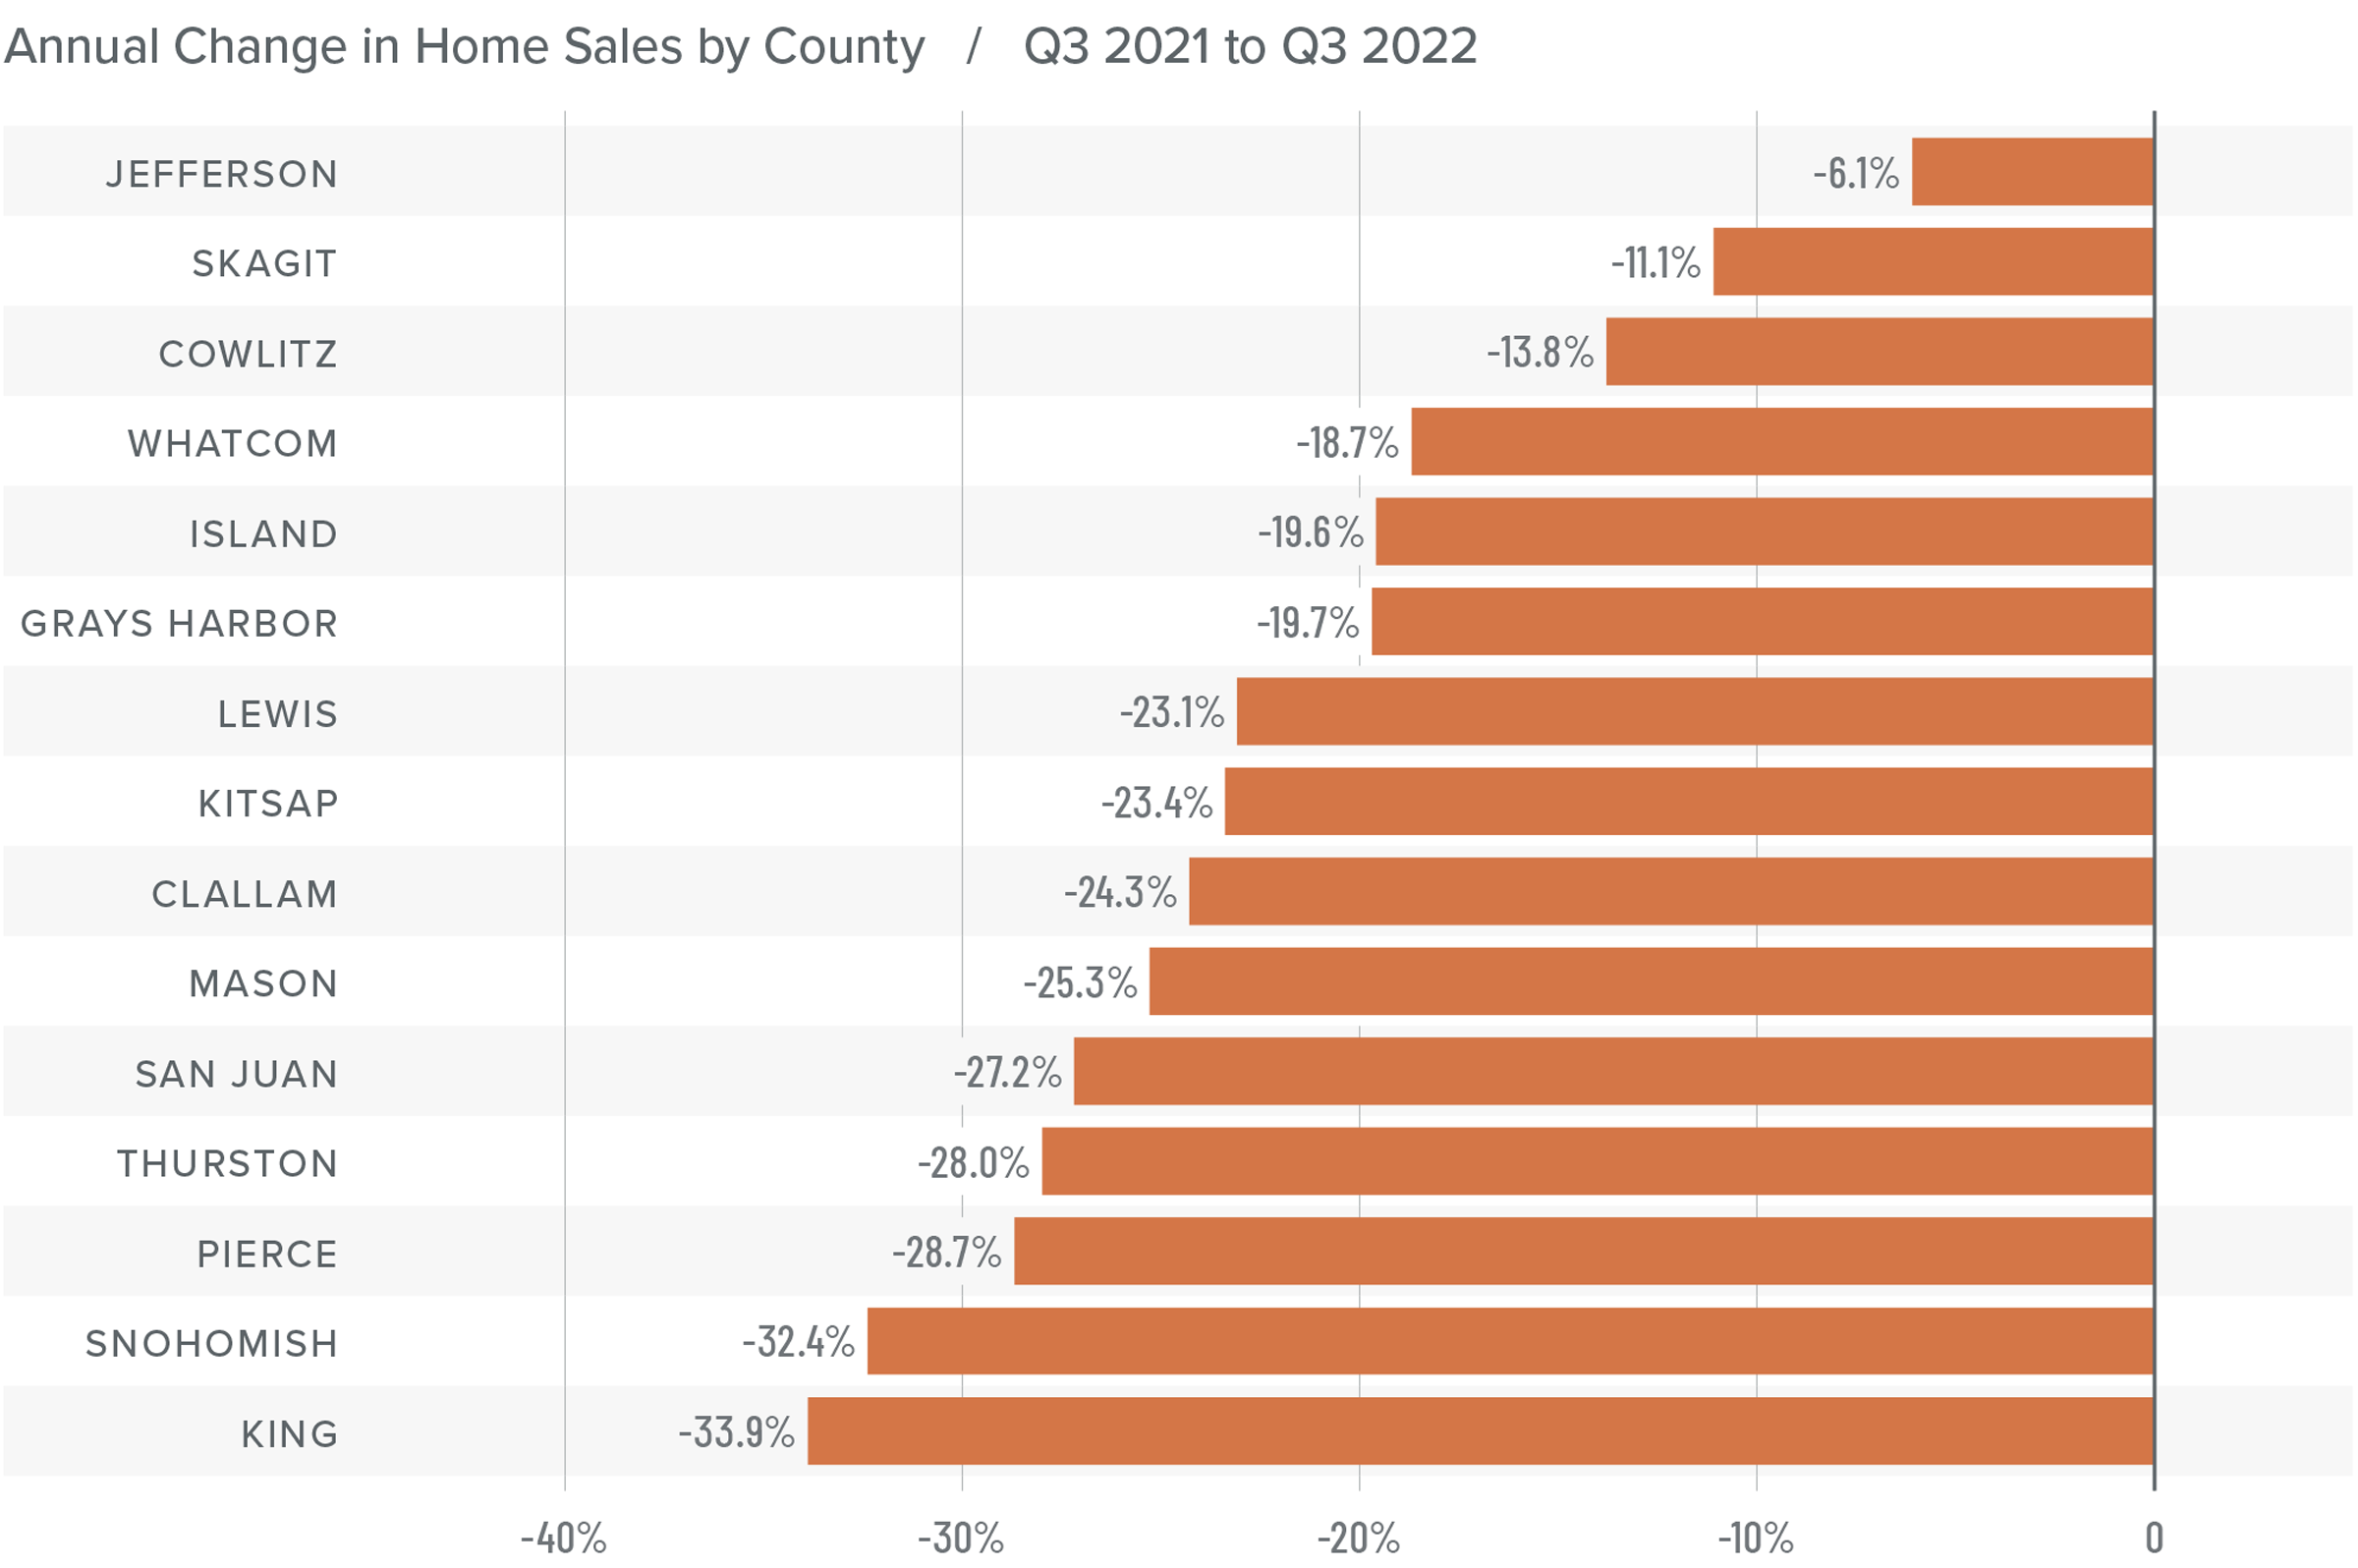
❱ In the third quarter, 19,455 homes traded hands, representing a drop of 29.2% from the same period a year ago. Sales were 15.4% lower than in the second quarter of this year.
❱ Listing activity continues to increase, with the average number of homes for sale up 103% from a year ago and 61% higher than in the second quarter of 2022.
❱ Year over year, sales fell across the board, but when compared to second quarter they were higher in Mason, Cowlitz, Jefferson, and Clallam counties.
❱ Pending sales (demand) outpaced listings (supply) by a factor of 1:6. This ratio has been dropping for the past three quarters and indicates a market moving back toward balance. The only question is whether it will overshoot and turn into a buyer’s market.
Western Washington Home Prices
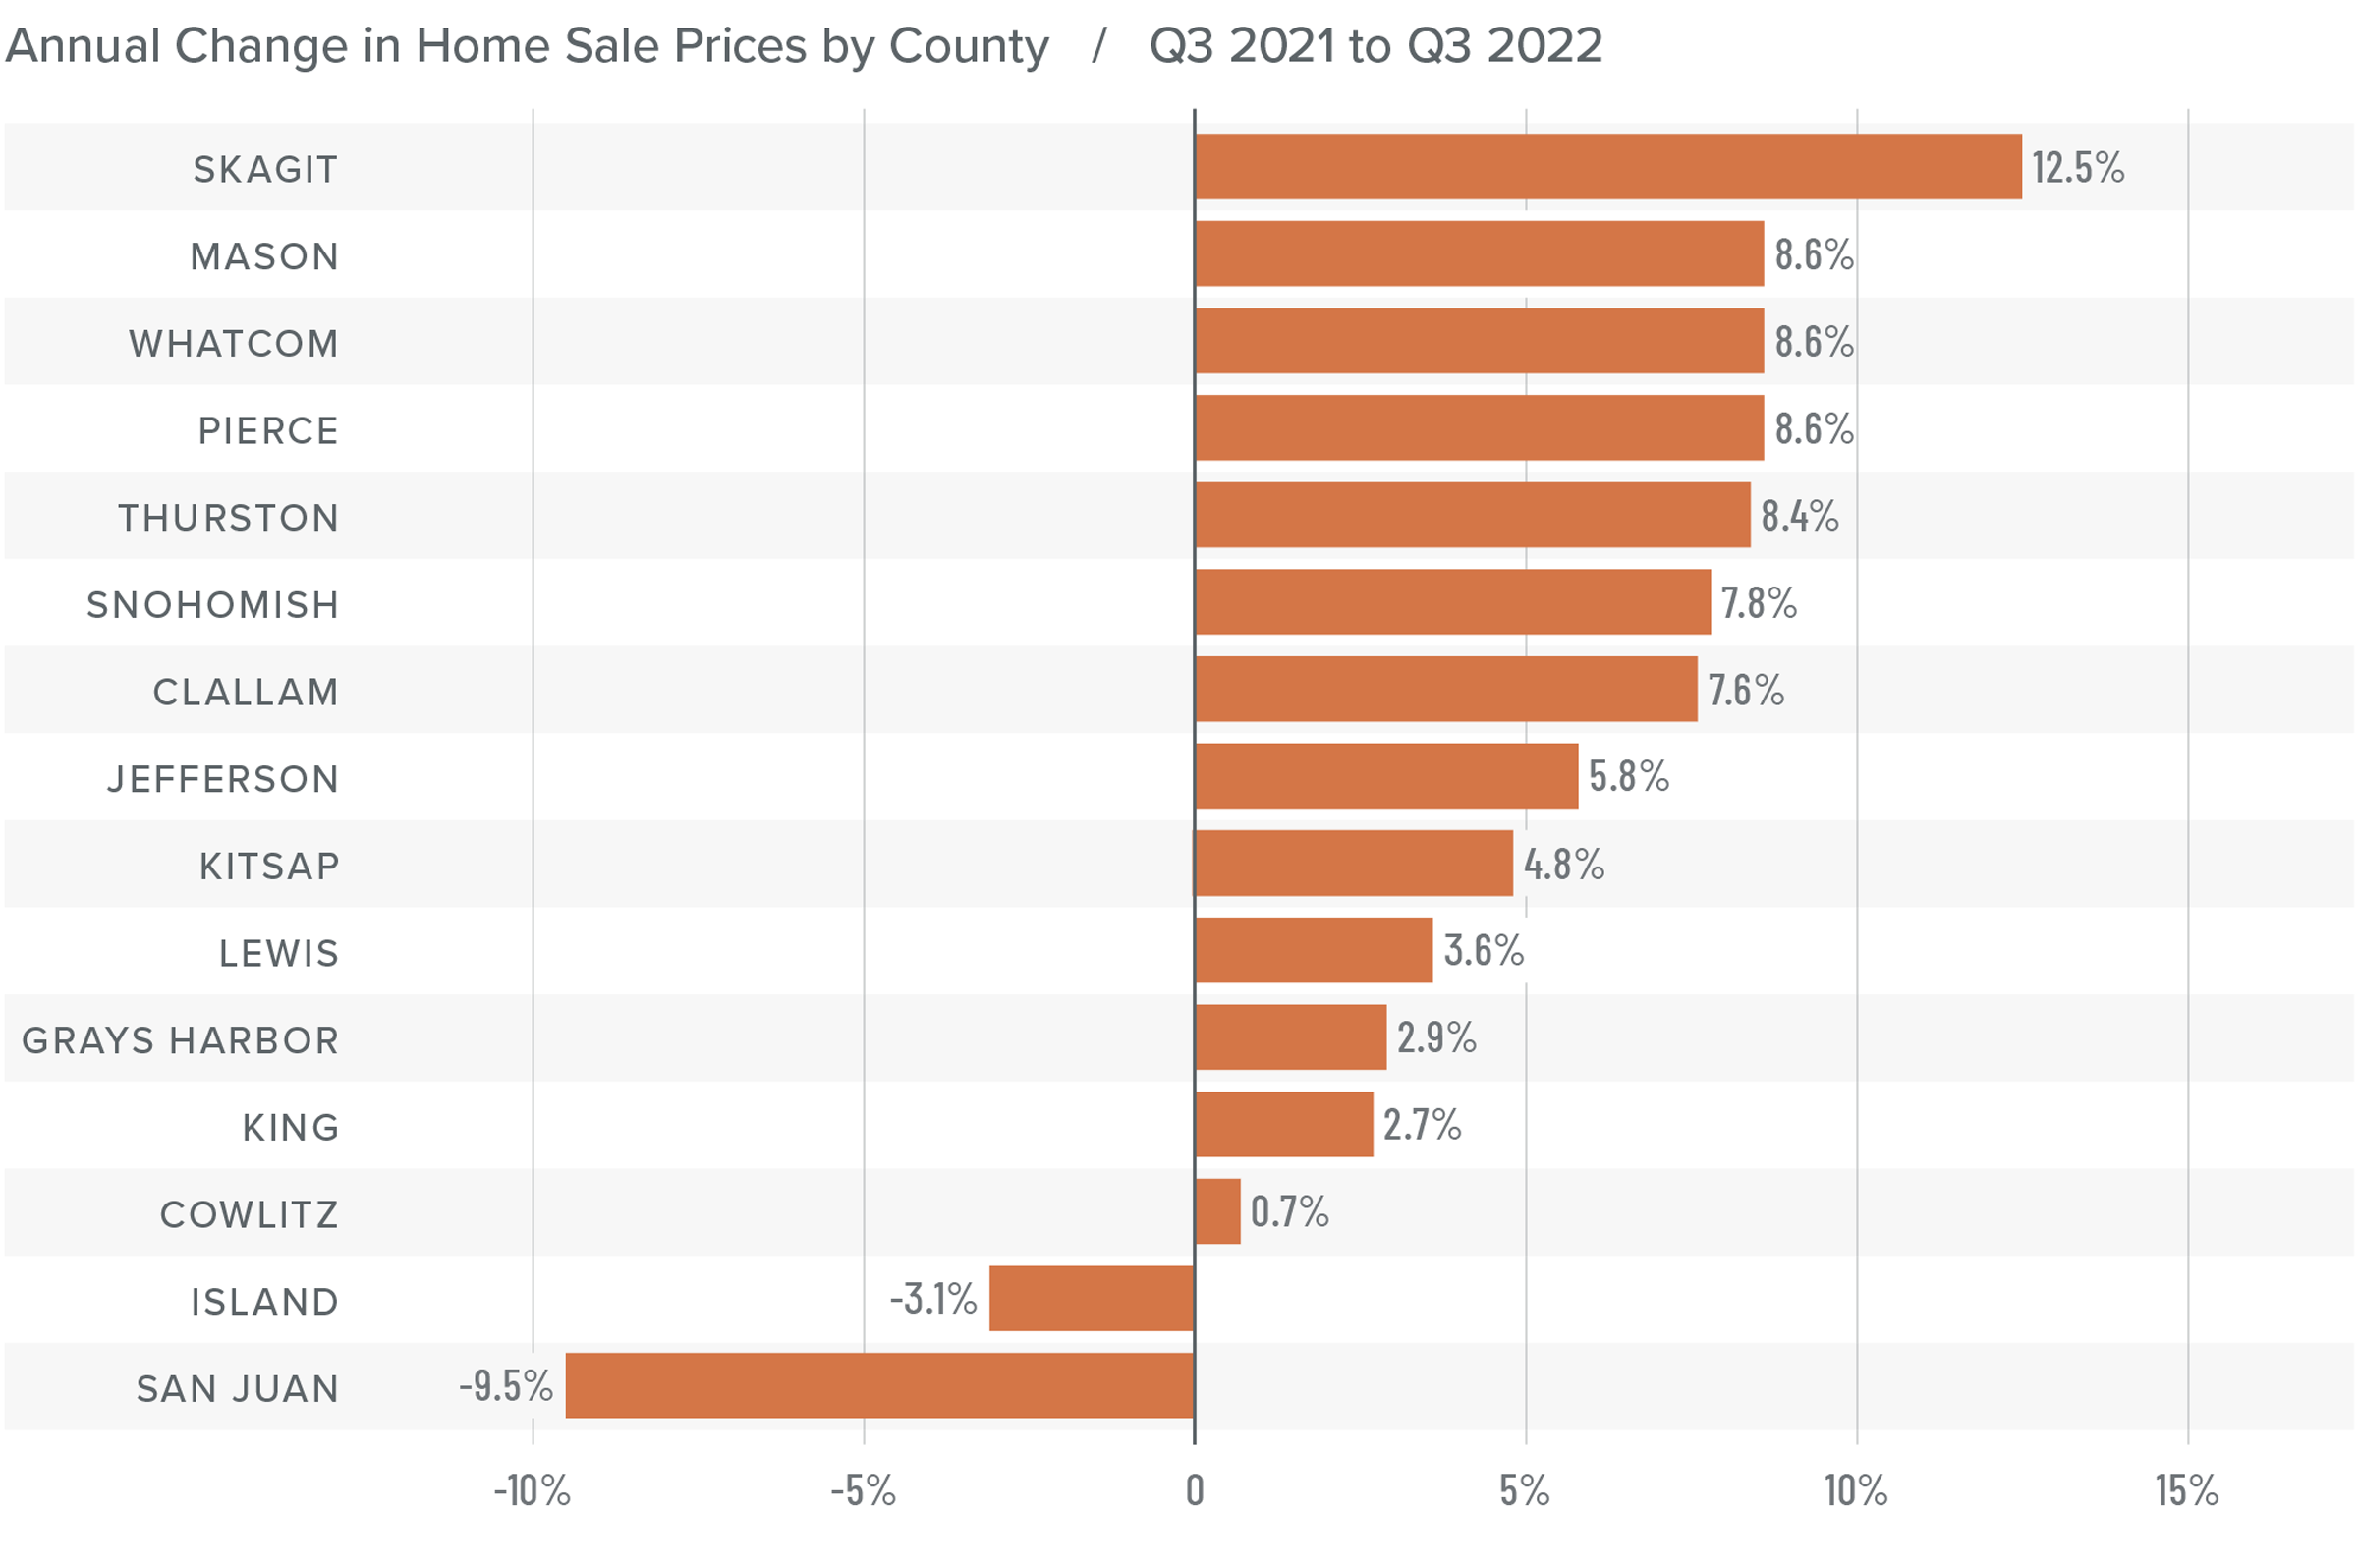
❱ Higher financing costs and more choice in the market continue to impact home prices. Although prices rose an average of 3.6% compared to a year ago, they were down 9.9% from the prior quarter. The current average sale price of a home in Western Washington is $748,569.
❱ The change in list prices is a good leading indicator and we have seen a change in the market. All but two counties (Island and Jefferson) saw median list prices either static or lower than in the second quarter of 2022.
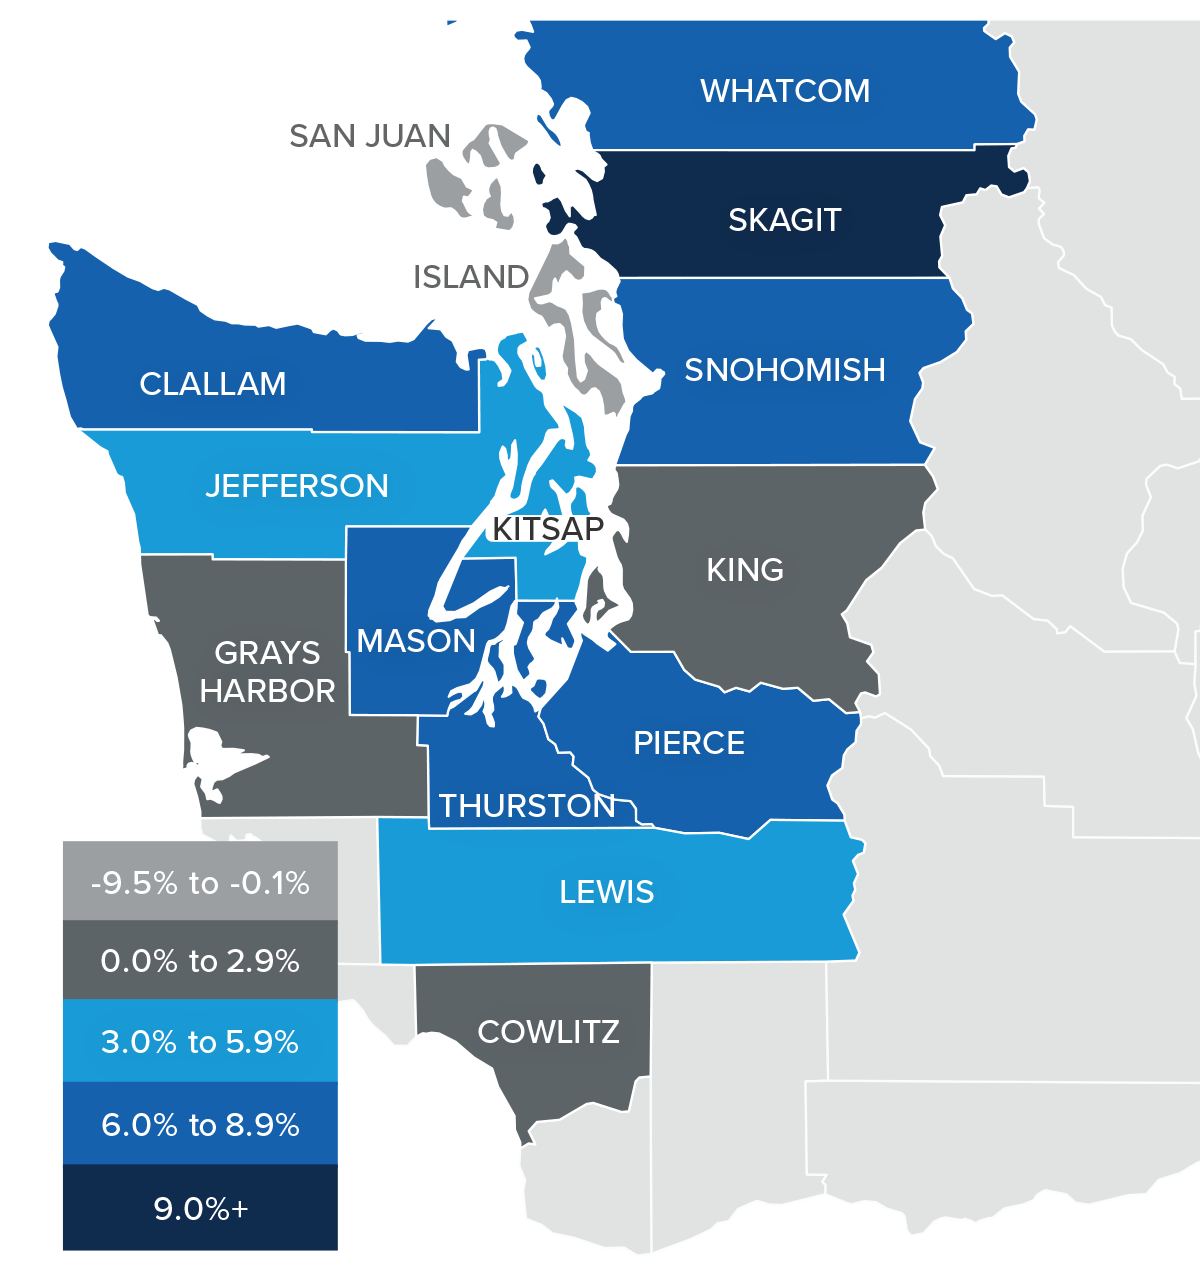
❱ Prices rose in all but two counties, and several counties saw price growth well above their long-term averages.
❱ With the number of homes for sale rising and list prices starting to pull back, it’s not surprising to see price growth falter. We are going through a reversion following the overstimulated market of 2020 and 2021. There will be some ugly numbers in terms of sales and prices as we move through this period of adjustment, but the pain will be temporary.
Mortgage Rates
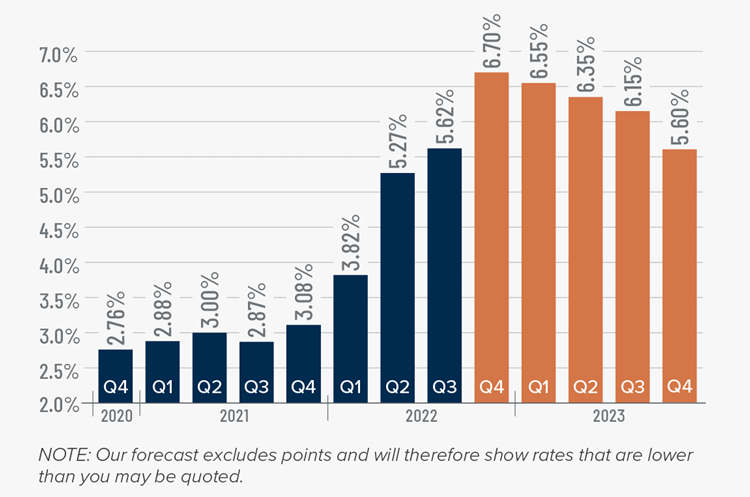
This remains an uncertain period for mortgage rates. When the Federal Reserve slowed bond purchases in 2013, investors were accused of having a “taper tantrum,” and we are seeing a similar reaction today. The Fed appears to be content to watch the housing market go through a period of pain as they throw all their tools at reducing inflation.
As a result, mortgage rates are out of sync with treasury yields, which not only continues to push rates much higher, but also creates violent swings in both directions. My current forecast calls for rates to peak in the fourth quarter of this year before starting to slowly pull back. That said, they will remain in the 6% range until the end of 2023.
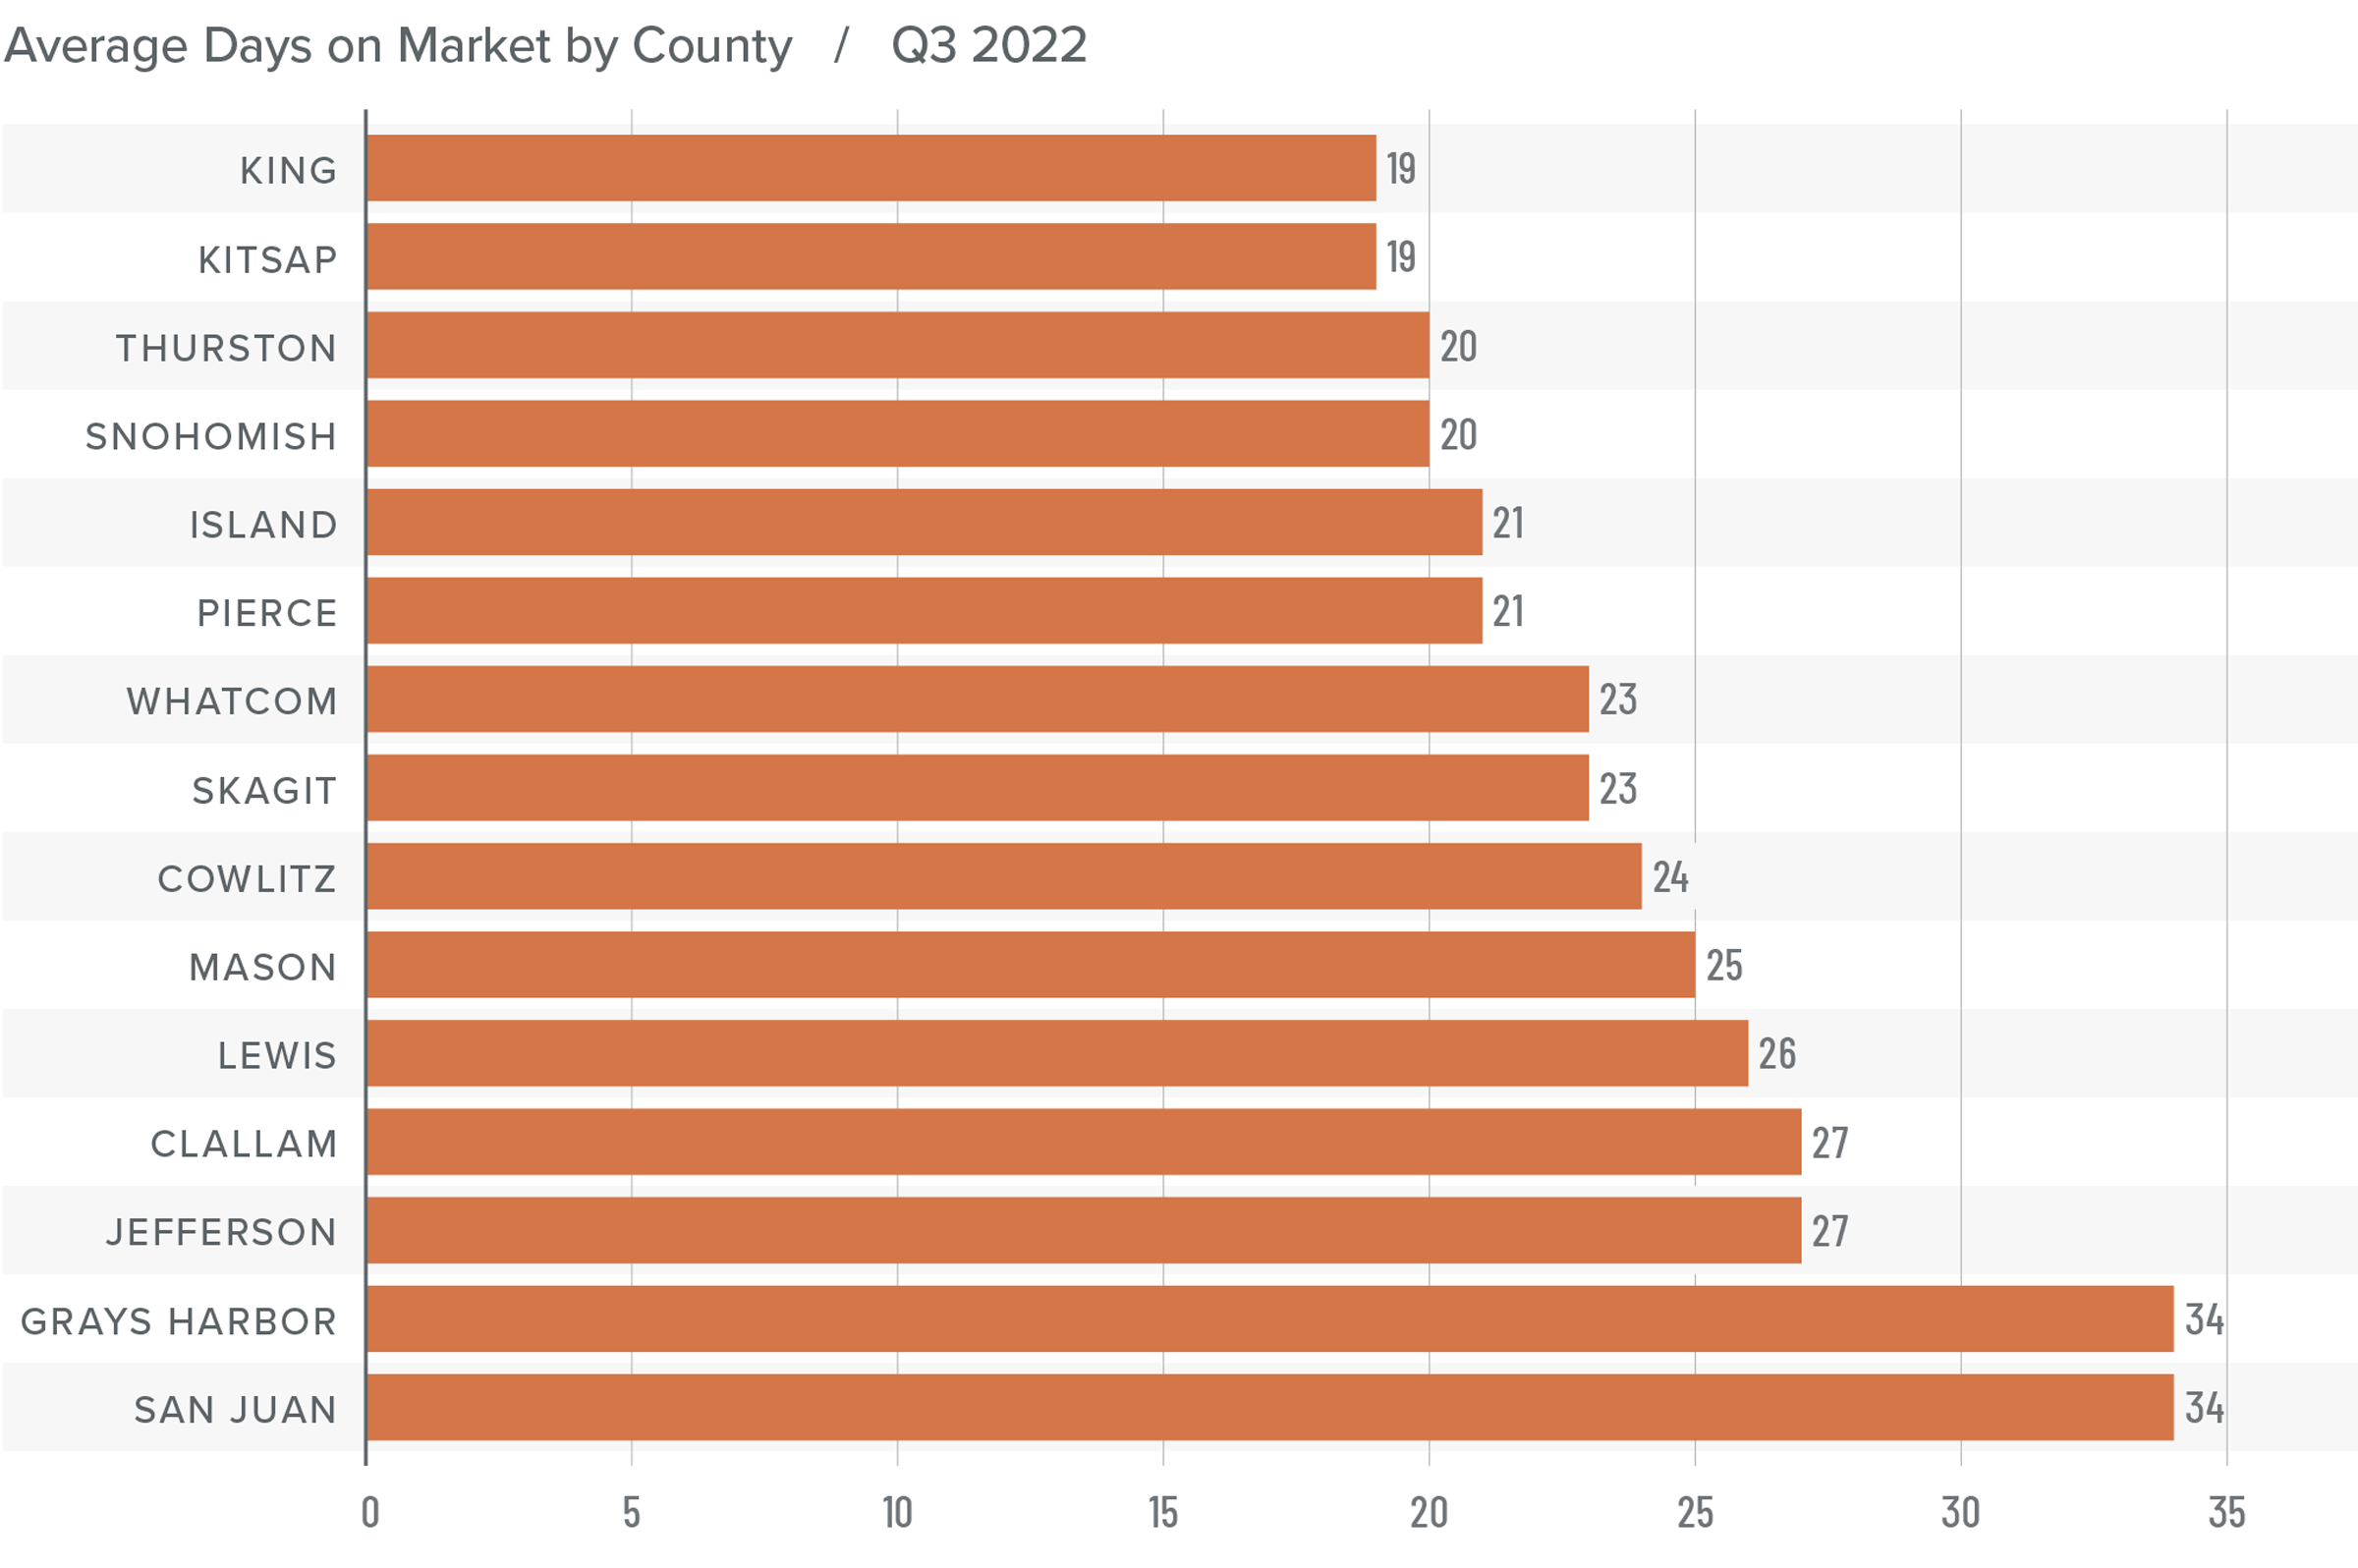
Western Washington Days on Market
❱ It took an average of 24 days for a home to sell in the third quarter of the year. This was seven more days than in the same quarter of 2021, and eight days more than in the second quarter.
❱ King and Kitsap counties were the tightest markets in Western Washington, with homes taking an average of 19 days to sell.
❱ Only one county (San Juan) saw the average time on market drop from the same period a year ago. San Juan was also the only county to see market time drop between the second and third quarters of this year.
❱ The greatest increase in market time compared to a year ago was in Grays Harbor, where it took an average of 13 more days for homes to sell. Compared to the second quarter of 2022, Thurston County saw average market time rise the most (from 9 to 20 days).
Conclusions
This speedometer reflects the state of the region’s real estate market using housing inventory, price gains, home sales, interest rates, and larger economic factors.
Listings are up, sales are down, and a shift toward buyers has started. After a decade of sellers dominating the market, it is far too early to say that the shift is enough to turn the market in favor of buyers, but the pendulum has started to swing in their direction. A belief that the housing market is on its way to collapsing will keep some buyers sidelined, while others may be waiting for mortgage rates to settle down. Whatever their reasons, I maintain that we will see a brief period where annual price growth will turn negative in several markets, but it is only because the market is normalizing. I certainly don’t see any systemic risk of home values falling like they did in the mid-to-late 2000s.

All things considered, I have moved the needle toward buyers, but it remains, for the time being, a seller’s market.
by Matthew Gardner

