Harvard University’s latest edition of “The State of the Nation’s Housing” has arrived, and Windermere Chief Economist Matthew Gardner is here to break down what the data presented in the report means for the U.S. housing market in 2023 and beyond.
This video is the latest in our Monday with Matthew series with Windermere Chief Economist Matthew Gardner. Each month, he analyzes the most up-to-date U.S. housing data to keep you well-informed about what’s going on in the real estate market.
Housing Market 2023
Hello there, I’m Windermere Real Estate’s Chief Economist Matthew Gardner, and welcome to this month’s episode of Monday with Matthew. I spend a lot of time reading reports that relate to the housing market, but there is one in particular I’m always impatiently waiting for, and it’s published by my colleagues at the Joint Center for Housing Studies at Harvard University. Every year they release the The State of the Nation’s Housing report and it’s packed full of fascinating data about the ownership and rental housing markets, demographics, and it also discusses the challenges that lay ahead. So today, I wanted to touch briefly on just a few of the report’s high points, but I highly recommend you download it from their website.
What’s happening in the housing market?

As we all know, the for-sale housing market started softening in mid 2022 in response to rising interest rates and deteriorating affordability. What was particularly notable was that seasonally adjusted home prices fell month over month last July and that was the first monthly drop in over a decade. And over in the rental market, asking rents—while still up year over year—also saw their pace of growth slow considerably, and that is a concern.
Is home construction slowing down?

As you see here, multifamily construction continued to rise last year even as rental demand was softening. In fact, 547,000 new multifamily units were started in 2022, the highest number since the mid-1980s, and the 960,000 units under construction in March 2023 was the highest number seen in half a century. On the ownership side, it wasn’t surprising to see single-family construction falling significantly as buyers reacted to sharply higher borrowing costs.
The report also suggested that the decline in new construction was particularly acute for lower-priced homes. Builders just can’t produce entry-level product with current material, labor, and land costs; limited lot availability; and regulatory barriers such as minimum lot sizes that restrict production of entry-level housing production.
U.S. Population Demographics

Now turning to demographics. Population growth—naturally the primary long-term driver of household growth—remains historically low. Overall, the U.S. population grew by 1.26 million people last year, or just 0.38%. Now, while this does represent a slight uptick from previous years that’s really not saying much as U.S. population growth hit 100-year lows in 2019, 2020, and 2021.
Increases in a country’s population come in two ways. The first is “natural” growth—which equals the number of persons born minus the number that have died—and the second is via immigration. Now, gains from immigration can be fickle because they are subject to unpredictable government policy changes as well as economic cycles here in the U.S. as well as in other countries. But natural growth is more predictable because it is driven by slow-moving factors like birth and mortality rates. Until last year, natural growth had been the primary source of population growth in the U.S., but, as you saw in that last chart, things have shifted.
U.S. Population Growth & Migration

This map shows counties with the highest level of natural growth and it’s dominated by large metro markets in California, Texas, Southern Florida and parts of the Northwest. But, what I found very interesting was that the numbers were remarkably low. Only six counties—three in California, two in Texas, and one in New York—saw natural growth above the 10,000 level and 75% of counties across the country saw negative natural growth.

So with natural growth slowing, states will understand the importance of attracting new residents from other markets as domestic migration will become a more important driver of household growth and housing demand. Here you see that Maricopa County, AZ saw the largest gains from domestic migration but, statewide, Florida dominated last year with 319,000 people moving there. Texas came in second with a net gain of over 230,000 people. But on the other end of the spectrum, California was the biggest loser with net 343,000 people leaving, followed by New York who lost 300,000 residents.

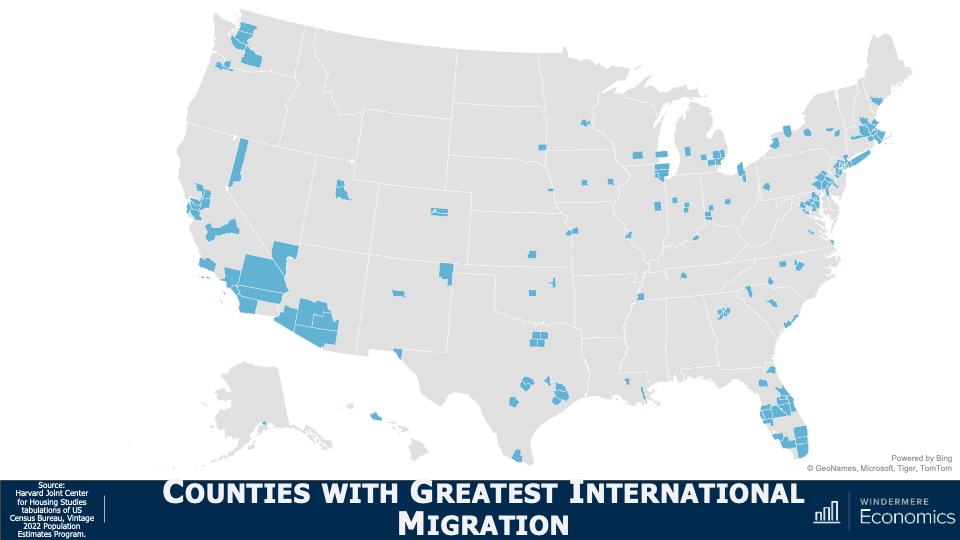
It was international migration that accounted for a full 80% of total growth last year and it was the largest source of total population growth for 26 states and 29% of all counties across the country. The biggest winners were LA County in California, Miami-Dade County in Florida, and Harris County, Texas.
These were just some of the highlights of the report and the biggest conclusions I found were that, in the ownership market, supply will remain tight in the resale arena and new construction will not fill that void, especially as it comes to the entry level product. Housing affordability will not improve. This will continue to be a big issue across the country.
An oversupply of apartments coming online will further moderate rents, but renters will also find affordability to be a big concern. Demographic trends suggest that low domestic population growth going forward will lower new household formations and it’s quite likely that population and household growth will start to rely wholly on immigration earlier than the government expects.
So, there you have it. As always, I’d love to hear your thoughts on this subject so feel free to leave your comments below. Until next month, stay safe out there and I’ll see you soon. Bye now.

 Facebook
 X
X
 Pinterest
 Copy Link


