 Facebook
 X
X
 Pinterest
 Copy Link

Hello there, I’m Windermere Real Estate’s Chief Economist Matthew Gardner and welcome to this month’s episode of Monday with Matthew. The National Association of REALTORS® released their data on the U.S. housing market in August, and it contained a few things which I found interesting and wanted to share with you.
- U.S. Housing Market 2023: Home Prices, Demographics, and More
Listing Activity
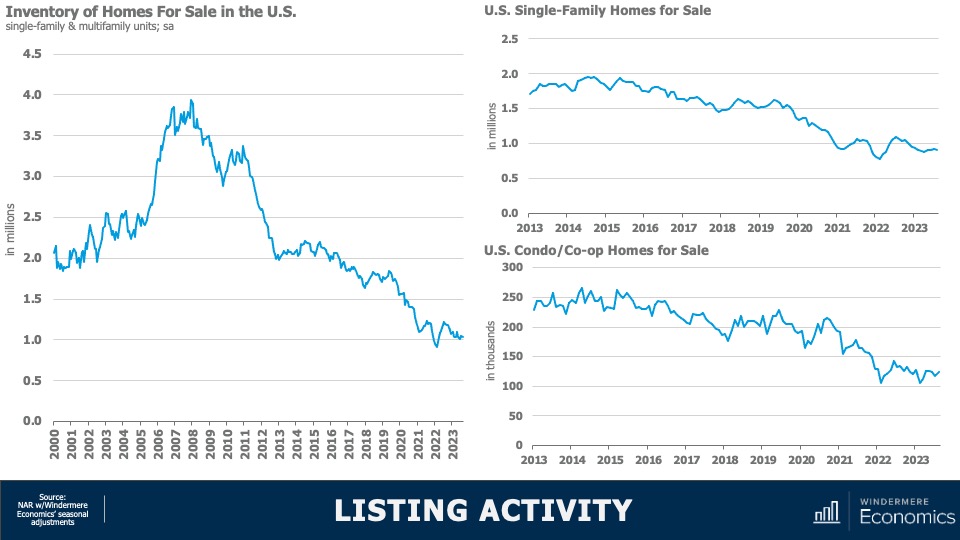
As you can clearly see here, the number of homes for sale remains at close to historic lows. When adjusted for seasonality, there were just 1.03 million single-family and condominium homes for sale in the month of August, and that’s down 8.3% from a year ago and the second lowest level in 2023. When adjusted for seasonal variations, there were just over 911,000 single-family homes for sale in the month, that’s 15% lower than a year ago and 36% below August of 2019. And the condominium market is not faring any better with just over 123,000 units available for purchase, listing activity was down year-over-year by just over 9%.
Homes for Sale August 2023
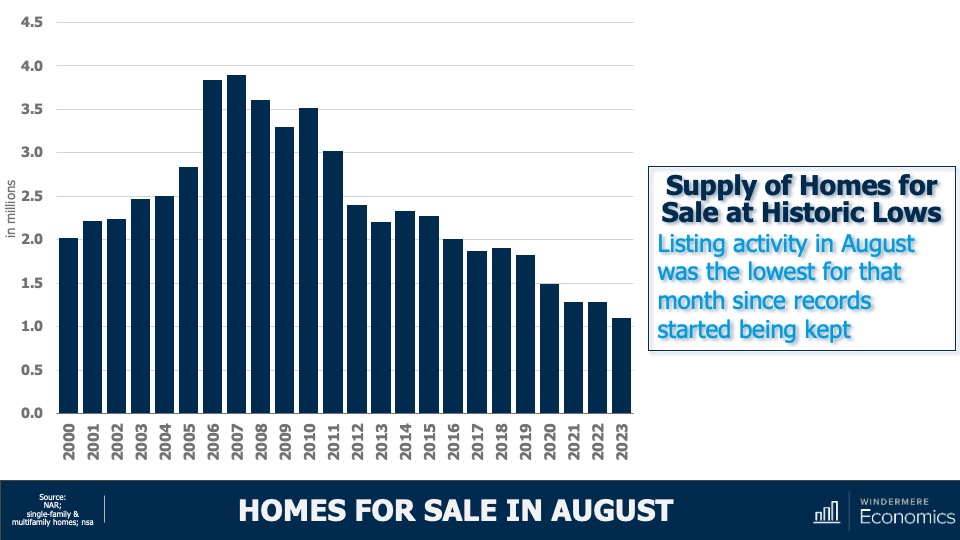
And to give you a little different perspective, this chart shows you the total number of units for sale in the month of August going back more than 20 years and I think it gives a pretty good indication as to how tight the U.S. housing market really is.
Now, we’ve talked before about the reasons why supply is so limited, and the blame is almost totally attributable to mortgage rates with sellers remarkably reluctant to move because that would mean losing the historically low mortgage rate that they currently benefit from. And as the old saying goes, “you can’t buy what’s not for sale,” and this is certainly true in the housing market today.
U.S. Housing Market 2023: Sales Activity
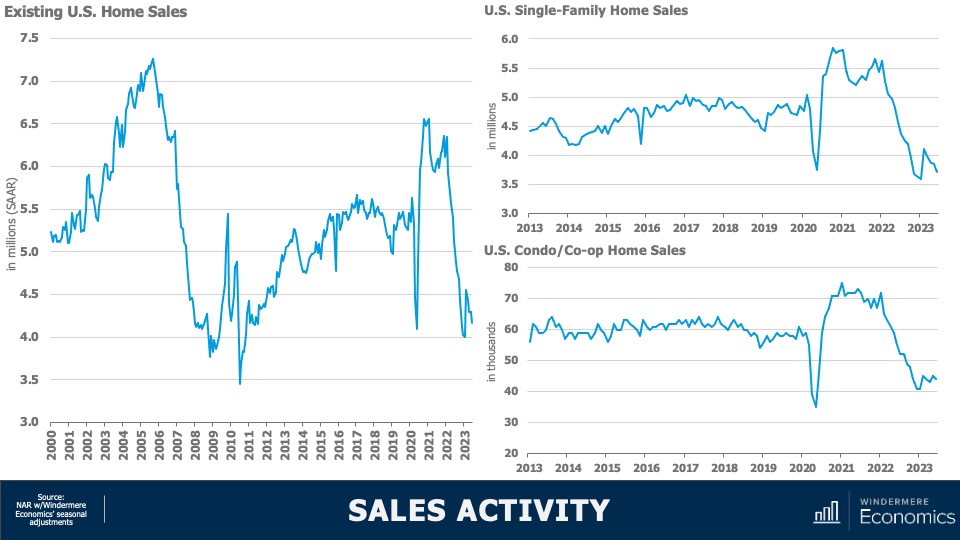
With such limited choice in the marketplace, it’s unsurprising to see home sales having plummeted following the pandemic induced surge we saw in 2021. At an annual sales rate of 4.04 million units, that is only 40,000 more than the low seen this January and we are now holding at levels we haven’t seen since 2010. Interestingly, single-family sales did see a little jump at the start of this year, but they have since pulled back—likely a function of rising financing costs, which were getting close to 7% in June.
But the condominium market, while certainly down significantly, appears to be somewhat more resilient. I find this interesting as we have not seen any palpable increase in listing activity for multifamily units.
Home Sale Prices Off All-Time High
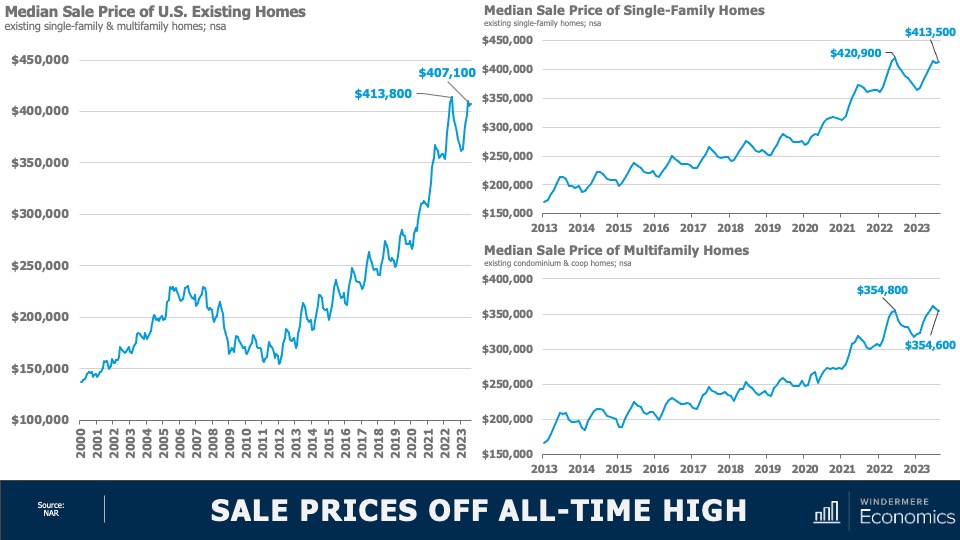
When prices started to fall in the summer of 2022, many expected to see them continue to plunge in a manner similar to that seen following 2007 collapse, but that has certainly not been the case. Sale prices have rebounded and remain remarkably resilient—especially given significantly higher financing costs.
- Although we did see a small drop in home prices between June and July of this year, U.S. home prices are only 1.6% below their 2022 peak; they’re up 3.9% year over year; and up by 11.1% from the start of 2023.
Single-family home prices paint a similar picture with prices down by 1.8% from peak; but up 3.7% year over year, and up 11.2% from the start of the year. Interestingly, sale prices in the Northeast were actually 3.5% higher in August than their 2022 peak. And condominium prices are just 0.1% below the high seen in June of last year. Prices are now up 6.2% year over year and are 11.6% higher than we saw at the end of 2022.
Now, of course the data shown here is unlikely to reflect the recent surge in mortgage rates so it will be interesting to see what impact that has not just on sales but sale prices when the September and October data is published.
My intuition suggests that—even with mortgage rates where they are today—as long as they don’t move significantly higher, prices at the national level are unlikely to collapse. But I do see sales volumes pulling back further as listing activity remains very constrained.
Price Growth vs Payment Growth
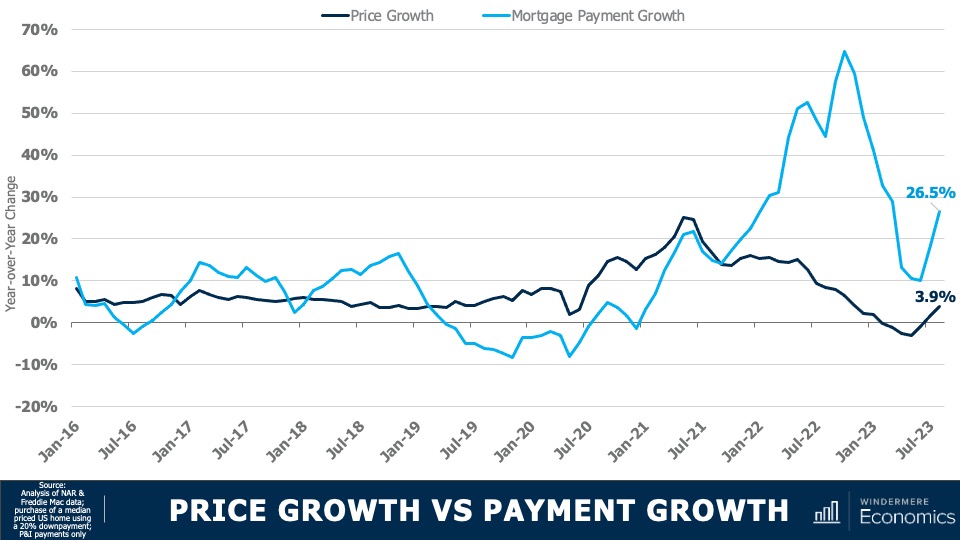
This chart shows a different way to look at the impact that mortgage rates are having on the market. The dark blue line shows year-over-year home price growth, and the light blue line shows the 12-month change in average mortgage payments.
Although we did see that annual growth in mortgage payments fall to just 10% in June of this year—the first time we have seen that since 2021—it has subsequently jumped back up. This means that a buyer of a median priced house in the U.S. is faced with payments that are 26 and a half percent higher than they were 12 months ago. At the same time, home price growth has stalled.
As I’ve mentioned in several past videos, I find it unlikely that inventory levels will increase significantly in 2023, and I also believe that supply will be constrained next year as well as rates remain at elevated levels.
As we know, it is this lack of inventory that has helped to support home prices; however, there is a breaking point. 10-year bond yields are holding at multi-year highs and do not appear to be thinking of pulling back at any time soon—especially given new bond issuances that the country is going bring to market in order to address our burgeoning debt levels.
And it’s because of this that I now expect to see rates remaining higher for longer, and the question then becomes how much tolerance will buyers have if mortgage rates hold where they are today or if they head closer to 8%.
Although I am not expecting this to happen, it is possible. And if it does, then sales will fall further and the underpinning of price stability will certainly be eroded. And there you have it. As always, I’d love to hear your thoughts on this subject so feel free to leave your comments below. Until next month, stay safe out there and I’ll see you soon. Bye now.

